III. SAMPLING DISTRIBUTIONS
A. SAMPLE MEAN
1. POPULATION VARIANCE KNOWN
a. NORMAL POPULATION
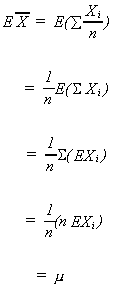
The mean of, when xi are iid with
is found by exploiting the fact that expectation is a linear operator
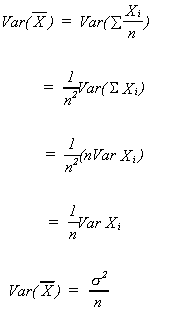
The var of is found by exploiting
the same property
DISTRIBUTION OF
Suppose
The sample mean is a linear combination of random variables that are normally distributed. We therefore conclude that
also

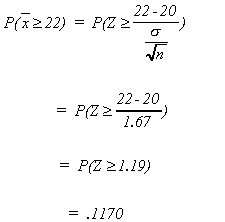
Example: Consider the population of errors in statistics books. We assume that
this r.v. is normally distributed. If we draw a sample of n = 9 from this population with= 20 and
= 25. What is the probability that
will exceed 22?
Note that as n increases, the variance ofdiminishes. Therefore
gets larger and the probability thatdiffers
from the population mean diminishes. Recall the weak law of large numbers.
b. NON-NORMAL POPULATIONS
Example: A machine produces 100 sneakers at a time. Because of air bubbles, etc., there is a probability of .1 that a randomly selected sneaker is defective.
The mean number of defectives in a production run is
the variance is
Using the CLT we assert that x, the number of defectives in a run, is a normal random variable. Hence
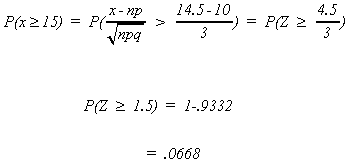
If we were 'doubting Thomas' and did it using the binomial we would find
Which is a fair approximation?
The following flow diagram should aid you deciding when to use the binomial and
when to rely on the normal as an approximation.
III. A.2. a. POPULATION VARIANCE UNKNOWN, NORMAL POPULATION
Consider the possibility that we do not know the population variance but do know
that our random variable has a normal distribution. Fortunately we have s2, the sample variance, which might serve as a
reasonable approximation of . Consequently,
we construct the new random variable

Note: 1. The expected value of this is still zero.
2. We have added some uncertainty in using s2
to approximate. In fact, the variance
depends on the sample size.
As a side note: Recall

and we can show
Let us divide theby its degrees of
freedom
and take its square root
Now consider dividing our N(0, 1) by our
to get

After canceling terms and rearranging we get
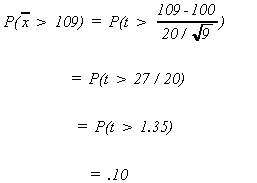
Example: Acreage sales are normal. For any given year suppose that the mean acreage per sale in a particular state is known to be 100. We have calculated s to be 20 from a sample of n = 9. What is the probability that our sample mean will exceed 109?
III. A.2. b. NON NORMAL POPULATION
If the population is non-normal andis
unknown then there is little that we can say, in a probabilistic sense, about the outcome
of a sampling experiment. However, real life is not the same as theory and you will often
see people using a t or normal probability table if the sample is reasonably large. This
is wrong!
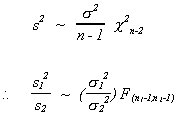
III.B.1. DISTRIBUTION OF s2
Assume
Recall
where

or
Note
recall
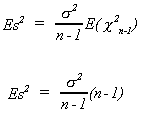
Also
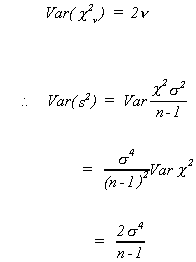
We therefore conclude the following
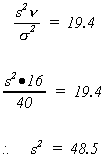
Example: Find s2 when n = 17, = 40
From the chi square tables we find 'a' = 19.4
III.B.2. DISTRIBUTION OF s12/s22
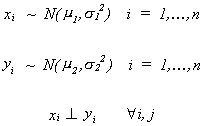
Assume
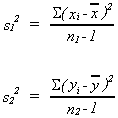
Recall
