Temple University
Department of Economics
These notes present Paul Samuelson's essay "Where Ricardo and Mill Rebut and Confirm Arguments of Mainstream Economists Supporting Globalization", Journal of Economic Perspectives, 18(3), Summer 2004, Pages 135-146. In that essay he shows the veracity of the mainstream argument that in a static world free trade lifts everyone's boat. He also shows that in a world with innovation the argument may no longer hold water.
H.F. Judson writes in "The Great Chinese Experiment", Technology Review, 108(11), December 2005, Pages 52-61 that the Chinese are investing to make the nation #1 in the world in science and technological development. Science usually leads to productivity gains. Further, their population is expected to decline after 2025. Both observations are germane to the examples presented here.
Workforce:
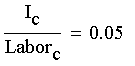
In the example that we are working with, the population of China is ten times that of the United States.
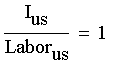
Productivity:
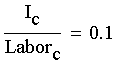
We can find average productivity in each of the two countries:
Average productivity in China is .125. Average productivity in the US is 1.25, ten times greater than that in China. This is true for the geometric and harmonic means as well.
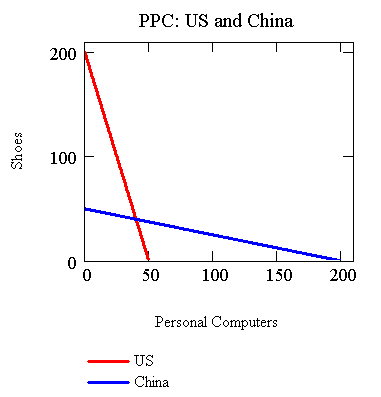
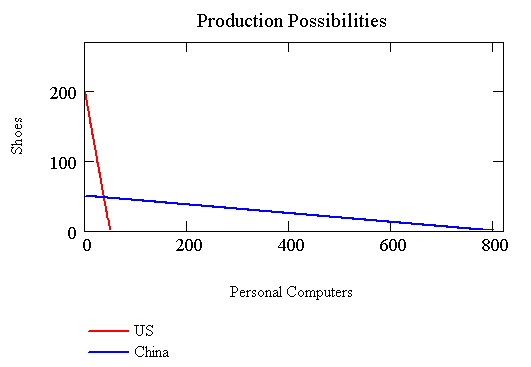
Now for the countries' production possibilities curves. The US can produce at most 200 (=2x100) shoes and 50 (=100x(1/2)) PCs. China can produce at most 50 shoes and 200 PCs.
From the figure you can see that the US has both the comparative advantage and the absolute advantage in shoes, while China has both the comparative advantage and the absolute advantage in personal computers.
Case I: No Trade -- Autarky
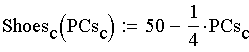
In the US the price of a PC is 4 shoes. If Americans split their income evenly between shoes and PCs then they will choose to produce 100 shoes and 25 personal computers. This is found from
Guess:
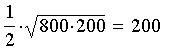
Real income is the geometric mean of these two choices. This form of real income is the money-metric utility of particular choices derived from homothetic preferences.
/1/
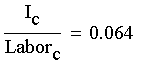
To get per capita income in the US we just divide by the population.
Per capita income:
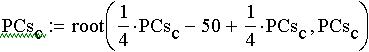
Going through the same calculations for China:
Guess:
Per capita income:
In the autarky case, the case of no trade, US per capita income is ten times that in China.
Case II: Free Trade
Now suppose that there is free trade. Depending on your perspective, the film Sandpebbles with Steve McQueen or Nixon's trip to China in 1971 will come to mind. In any case, in our example there are no barriers to trade between the two nations. The combined production possibilities curve for the two countries is now seen to be:
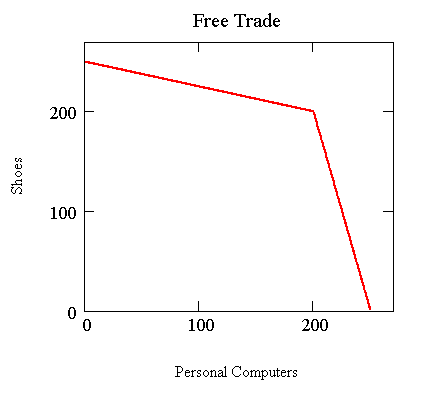
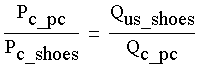
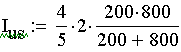
With free trade each country will specialize in the good for which they have a comparative advantage. China will produce PCs and the US will produce shoes. Each country will trade some of the good in which they have specialized for some of that good being produced by the other country. The US will produce 200 shoes. China will produce 200 computers. When residents of each country continue to divide their income equally between the two goods and there is free trade, the ratio of the price of shoes to the price of a PC must be equal in both countries. The only way both conditions can be satisfied is if one computer trades for one shoe in the world market. The Chinese will sell 100 of their computers to the US for 100 shoes, and consider this a good deal. Similarly, the US is willing to sell 100 shoes to China for 100 computers and consider this a good deal. Now we can recompute national income for each country.
Income has doubled
Per capita income has also doubled.
The algebra of the example is such that if there is a population decline in China relative to that in the US then China's per capita income will increase, and come at the expense of a reduction in the gain that would otherwise accrue to the US.
Case III: Free Trade and China experiences an increase in productivity
China experiences a change in productivity in its export good, computers. All other productivities are unchanged.
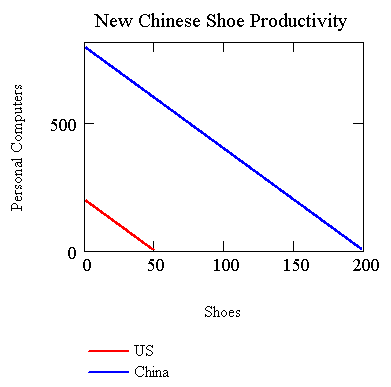
The production possibilities curves now appear as
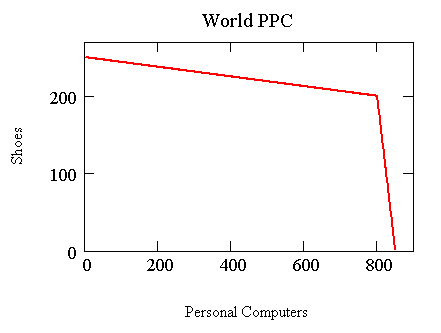
Since there is still free trade we also need to redraw the combined Production Possibilities curve for the whole world.
Each country will specialize in the good in which it has a comparative advantage. The US will still produce 200 shoes and China will produce 800 conputers. But China produces so many computers now that they swamp the terms of trade. Previously China offered as many as 4 computers for 1 shoe, China is now willing to offer as many as 16 computers in order to get 1 shoe.
Now there are two subcases to consider.
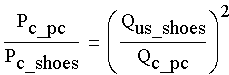
III(a) China's demand is somewhat inelastic. A demand curve like
will do the trick and is derivable from a utility maximization problem./2/ Note the inverse relationship between reservation price and quantity demand.
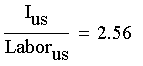
Each country gets 1/2 of world production
So each country is clearly better off than before the invention.
III(b) China's demand is highly inelastic. A demand curve like
will do the trick and is also derivable from a utility maximization problem.
/3/
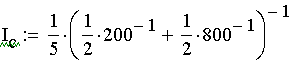
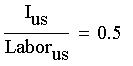
In this circumstance China's demands for the two goods are inelastic. In spite of the relative increase in the price of shoes, they do not change their quantity demanded. Furthermore, because of their huge productivity increase, the decline in the value of a computer, and their inelastic demand for computers, they now obtain only a 1/5 th share of world output. Because of the change in the demand relationship the relevant mean of world output is the harmonic mean, not the geometric mean as before.
The US has been made much better off. China has been made worse off by their own invention!! This is known as self immiseration and is not uncommon in the real world.
Case IV: Free Trade and China invents more productive technology for Shoes
Productivities: China invents new shoemaking techniques.
Immediately note that the US comparative advantage in shoes is gone, as is the Chinese comparative advantage in computers. Now China has an absolute advantage in both goods. There are no advantages to trade. Under the new level of Chinese shoe productivity the production possibilities curves look like
Since there is no incentive for (net) trade it is an easy matter to determine income in both places. We return to the instance of somewhat inelastic demand and calculate income using the geometric mean.
With the Chinese innovation in shoe production the US is forced back into autarky and its national income falls to the pre-trade level. Since they have become so productive in shoe production the Chinese are better off than they were pre-invention and with free trade.
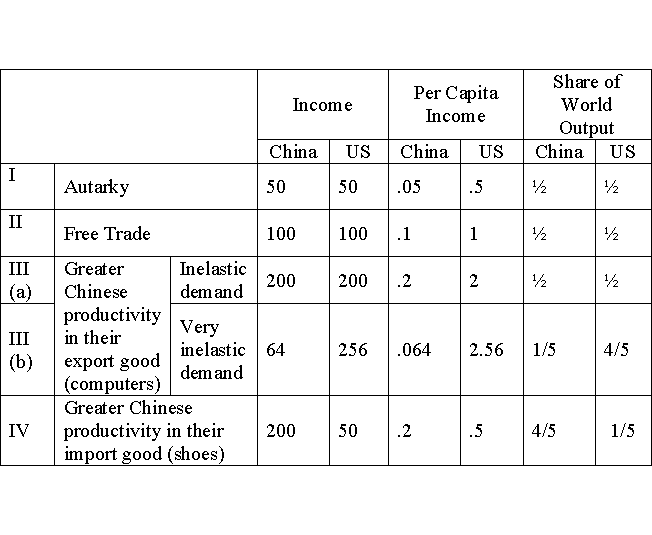
We can summarize the results in a table:
In reading the table the appropriate comparisons are the last three rows, in which free trade is possible, with either of the first two rows.
_________________________________________________________________
1. Indifference curves for
homothetic utility functions have the same slope along any given ray from the
origin. Return
2. A utility function that can do
the job is of the sort U = Ln(PCs) + Ln(Shoes). Return
3. A utility function that can do
the job is U = Ln(PCs) + Shoes. Return