Page 1
1. When excess demand occurs in an unregulated market, there is a tendency for
a. price to fall.
b. quantity supplied to decrease.
c. quantity demanded to increase.
d. price to rise.
2. In college you practically existed on tuna fish, but now that you have a $45,000 a year job, you never want to see tuna fish again. We can safely conclude that you consider tuna fish to be
a. an inferior good.
b. a luxury.
c. a normal good.
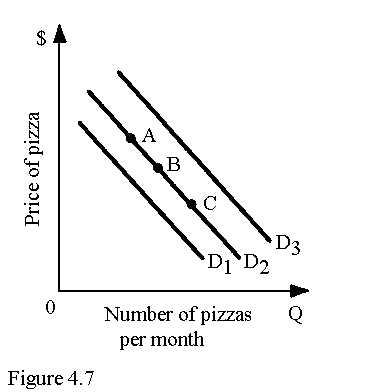
3. Refer to Figure 4.7. A movement from point C to point B on demand curve D2 would be caused by
a. a decrease in the price of hamburgers, assuming that pizza and hamburgers are substitutes.
b. an increase in the price of pizza sauce.
c. a decrease in income, assuming pizza is a normal good.
d. a decrease in the price of pizza.
4. Apples and oranges are substitute goods. A freeze in Florida destroyed a good portion of the orange crop. Ceteris Paribus,
a. the price of oranges will fall and the price of apples will increase.
b. the price of both apples and oranges will increase.
c. the price of oranges will increase and the price of apples will fall.
d. the price of both apples and oranges will fall.
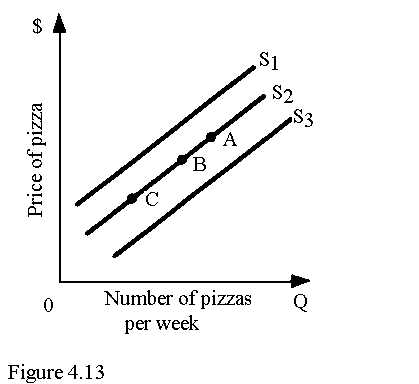
5. Refer to Figure 4.13. An increase in supply is represented by the movement from
a. point B to point A along supply curve S2.
b. S2 to S3.
c. S2 to S1.
d. point B to point C along supply curve S2.
6. An insect that is resistant to currently used pesticides has infested the cotton crop, and this year's crop is only half of what was produced last year. You accurately predict that this
a. will shift the supply curve of cotton to the left, the equilibrium price of cotton will increase, and the demand for cotton will fall.
b. will shift the supply curve of cotton to the right, the equilibrium price of cotton will increase, and the demand for cotton will fall.
c. will shift the supply curve of cotton to the right, the equilibrium price of cotton will increase, and the quantity demanded of cotton will decrease.
d. will shift the supply curve of cotton to the left, the equilibrium price of cotton will increase, and the quantity demanded of cotton will decrease.
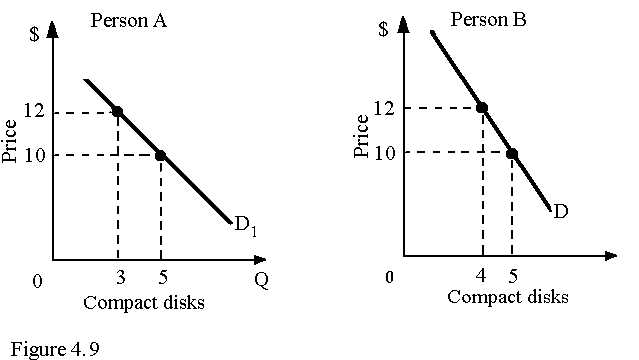
7. Refer to Figure 4.9. Assume that there are only two people in the market for compact discs: Person A and Person B. Along the market demand curve for compact disks, at a price of __________ quantity demanded would be __________.
a. $10; 13
b. $12; 7
c. $12; 5
d. $10; 16
Page 4
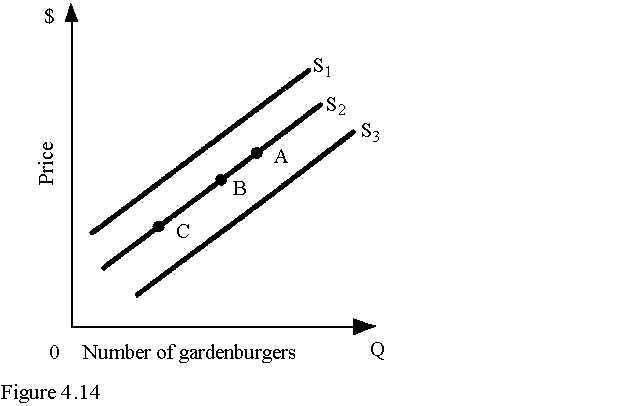
8. Refer to Figure 4.14. An increase in the wage rate of Gardenburger makers will cause a movement from point B on supply curve S2 to
a. point B on supply curve S2.
b. supply curve S1.
c. supply curve S3.
d. point A on supply curve S2.
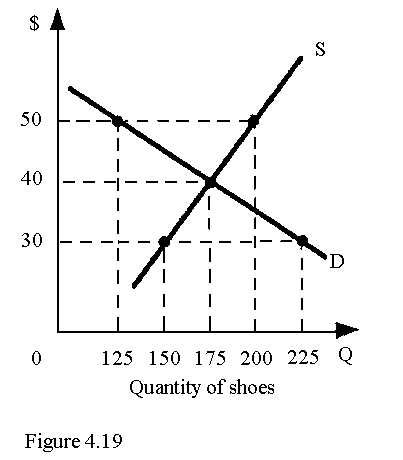
9. Refer to Figure 4.19. At a price of $50, there is an
a. excess demand of 50 shoes.
b. excess supply of 75 shoes.
c. excess demand of 75 shoes.
d. excess supply of 50 shoes.
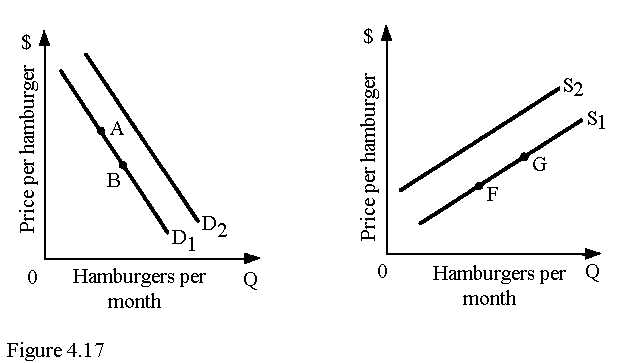
10. Refer to Figure 4.17. Assume hamburgers are a normal good. An increase in income will cause a movement from
a. D1 to D2.
b. S1 to S2.
c. point A to point B.
d. point G to point F.
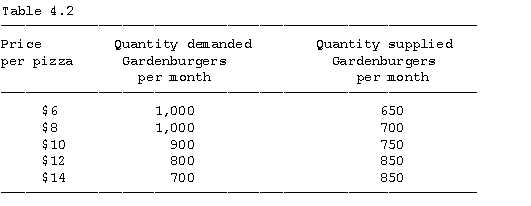
11. Refer to Table 4.2. If the price per Gardenburger is $6, there is
a. an excess supply of 50 Gardenburgers.
b. an excess demand of 150 Gardenburgers.
c. an excess supply of 150 Gardenburgers.
d. an excess demand of 450 Gardenburgers.
12. Which of the following will unambiguously occur when there is a simultaneous increase in supply and decrease in demand?
a. an increase in equilibrium quantity
b. a decrease in equilibrium quantity
c. a decrease in equilibrium price
d. an increase in equilibrium price
13. Refer to Table 4.2. If the price per Gardenburger is $14, there is
a. a market equilibrium.
b. an excess supply of 150 units.
c. an excess demand of 100 units.
d. an excess demand of 700 units.
Page 8
14. Refer to Figure 4.14. An increase in quantity supplied is represented by a movement from
a. S2 to S1.
b. point B to point C along supply curve S2.
c. point B to point A along supply curve S2.
d. S2 to S3.
Page 9
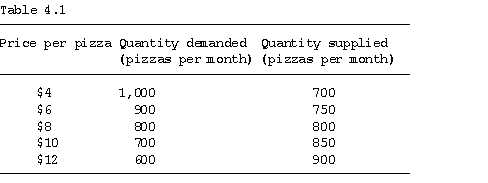
15. Refer to Table 4.1. In this market there will be an excess demand of 150 pizzas at a price of
a. $8.
b. $12.
c. $10.
d. $6.
16. Refer to Table 4.2. In this market there will be an excess supply of 150 Gardenburgers at a price of
a. $10.
b. $12.
c. $14.
d. $6.
Page 10
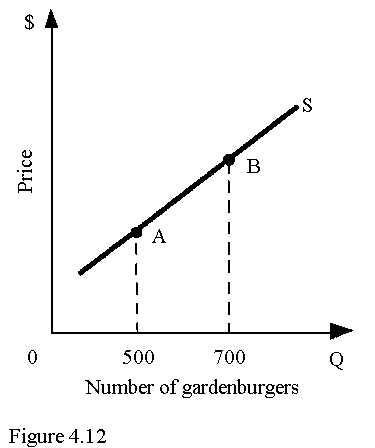
17. Refer to Figure 4.12. The number of Gardenburgers this restaurant sells per week decreases from 700 to 500. This could be caused by
a. an increase in the demand for Gardenburgers.
b. an improvement in technology that reduces the cost of making Gardenburgers.
c. a decrease in the price of Gardenburgers.
d. an increase in the price of one of the ingredients used to make Gardenburgers.
18. A decrease in demand for a product will cause the price of the product to fall and supply of the product to decrease.
a. True
b. False
19. A change in demand occurs if the "ceteris paribus" assumption is violated.
a. True
b. False
Page 11
20. On a demand curve, price is held constant.
a. True
b. False
Page 1
1. d
86
2. a
74
3. b
76
4. b
91
5. b
83
6. d
91
7. b
79
8. b
83
9. b
86
10. a
91
11. d
86
12. c
91
13. b
86
14. c
83
15. d
86
16. c
86
Page 2
17. c
81
18. False
89
19. True
76
20. False
76