Testing for Unit Roots
Time series analysis is about the identification, estimation and diagnostic checking
of stationary time series. By way of review we offer the following definitions:
Definition: The sequence {yt} is said to be
covariance stationary if for all t and t-s
- E(yt)= E(ys)= m
- E(yt-m)2 = E(yt-s-m)2
= s2
- E(yt-m)(yt-s-m)
= E(yt-j-m)(yt-j-s-m)
= gs
That is, the mean, variance and covariance are invariant to the time origin.
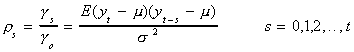
Definition: Suppose we have the sequence {yt}
(t=0,1,2,…) with mean m and variance s2. Then the autocorrelation function
or correlogram is given by
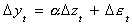
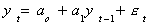
Suppose we have a series {yt} which we know to have been generated by an AR(1)
process, say,
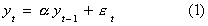
where  and et
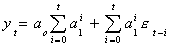
is white noise. We can estimate the parameters in (1) by OLS: Our estimator is efficient
and the series is stationary since
and et
is white noise. We can estimate the parameters in (1) by OLS: Our estimator is efficient
and the series is stationary since  . We
could use a t-statistic to test the hypothesis
. We
could use a t-statistic to test the hypothesis

This is a legitimate test since the null is a refutable hypothesis, even though the power
against a local alternate is negligible.
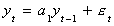
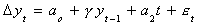
But suppose that the data was really generated by
Upon recursive substitution this can be rewritten as

which is nonstationary since  as t gets
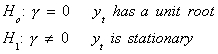
large. Now we would want to test
as t gets
large. Now we would want to test

There is a problem, however, since the center of mass of the usual estimator would be
bounded away from 1. We would tend to err on the side of rejecting too many H0 . The
question of the presence of a unit root is particularly problematic in regression models
of the sort
We usually assume that {yt} and {zt} are both stationary and
that et is white noise. If the two variables are nonstationary then we will
likely get spurious results: high R2 and statistically significant coefficients
even though there may not really be a meaningful relationship between y and z. There are
four cases to consider
- Both {yt}and {zt} are stationary and the classical regression
model is o.k.
- The sequences {yt} and {zt} are integrated of different orders.
Regression models containing such nonstationary series are meaningless.
- The nonstationary {yt} and {zt} are both integrate of order 1,
say, and the error term has a stochastic drift. Now all errors are permanent. That is Etet+i
= et . But we can apply OLS with good effect to
- {yt} and {zt} are integrate of the same order and the residual
sequence is stationary. Then {yt} and {zt} are said to be
cointegrated. For example:

Both {yt} and {zt} are unit root processes but yt-zt
= eyt-ezt is
stationary. We will leave case 4 until the chapter on cointegration. For now we will
concern ourselves with determining whether or not the series {yt} has a unit root.
Dickey-Fuller Tests
Consider the data generating process
And the associated question, is a1 = 1? Subtract y t-1 from both
sides to get
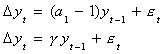
g=0 implies a1=1 implies a unit root in {yt}.
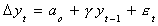
We can allow for drift by including an intercept
Definition: The term stochastic drift comes from the
following: Suppose that the process is
We can rewrite this as
In the next period, i.e. t+1, the intercept is aoa1t+1
larger, to which we add a stochastic term. We have seen this idea of a stochastic
intercept elsewhere. Namely in the random effects model.
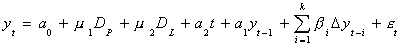
We can allow for a linear trend with drift
In any event, our test of hypothesis is
The test statistic we use for the test of hypothesis is constructed as a t-statistic.
That is

The critical values come from a set of tables prepared by Dickey and Fuller. The
tables were generated empirically. We are accustomed to doing tests with critical values
we have determined analytically by integration of a known distribution function.
The particular table to be used depends on whether the model has an intercept or a trend
in it. However, the critical values are not changed by including  terms on the right hand side.
To guide you in the testing procedure, consider the following flow diagram from Walter
Enders, Applied Econometric Time Series, Wiley, 1995.
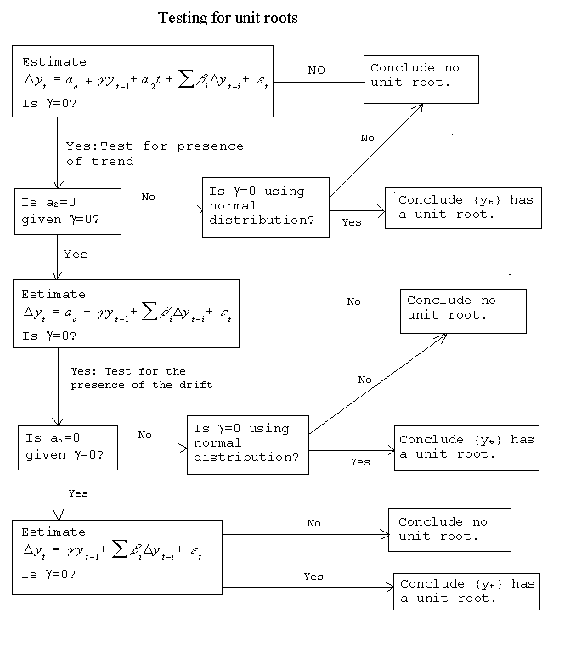
One starts in the top left corner with the most general model, that includes a stochastic
drift and a deterministic trend. Either the trend or the drift can produce the appearance
of a unit root in their own right, so they must be included at the outset. Recall that an
excluded relevant variable introduces bias, but an included irrlevant variable only has a
cost in terms of efficiency. If the null of a root is not rejected, then proceed by
testing for the significance of the trend term in the presence of a unit root. If the
trend term is not significant, then test for the significance of the drift term. If along
the way we find that either the trend or the drift is not zero then we proceed immediately
to to test for the significance of g.
Example
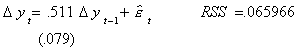
The following models have been fit to the Federal Reserve Bank production index for
the period 1950:1 - 1977:4, a total of 112 observations. In all three models the numbers
in parentheses are standard errors. The most general mode, corresponding to the start of
the flow diagram is
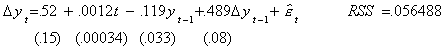
At the 5% level of test (2.5% in each tail) the critical value for the coefficient on
yt-1 for a model with drift and trend is -3.73, compared to an observed test
statistic of 3.6, so we fail to reject the null. For the moment we believe there to be a
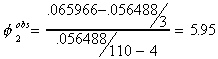
unit root. Next we fit a model which imposes the restriction that g=0,
and test to see if the trend coefficient is zero. Note that on the basis of a conventional
t-test, the trend coefficient is highly significant.
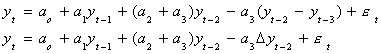
A model with drift but no trend and which supposes that there is a unit root is
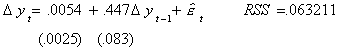
Now the test of hypothesis is
Ho: unit root, no trend
H1: one or both not true
The appropriate test statistic is constructed as though it was an F-test, but the critical
value is read from a different set of tables.
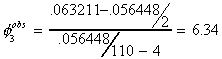
The critical value at the 5% level is 6.49, so we fail to reject the null. Our conclusion
to this point is that there is a unit root and that the trend should be excluded.
A model with neither drift nor trend, but which presumes a unit root is
The test of hypothesis is
Ho: unit root, no trend, no drift
H1: one or more belongs
The critical value at the 1% level of test is 6.50. Since our observed test statistic
is smaller than the critical value, we fail to reject the null. Our conclusion is that
there is a unit root, there is neither trend nor drift.
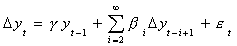
Extension of Dickey-Fuller
Suppose that the data generating process is

This is quite a bit more general than the process we started with. It will also admit
a multiplicity of roots. We need to augment Dickey-Fuller in order to test for this
possibility. Let us consider the AR(3) process

We will add and subtract a3yt-2 to get
Now add and subtract (a2+a3)yt-1 to get


Finally, subtract yt-1 from both sides


Now we can test for the presence of a unit root. We know that if the coefficients in a
difference equation sum to one then at least one root is unity. In the present context
this amounts to testing g=0, as in the simpler case. The
critical values for this augmented model remain the same as before. Parenthetically,
adding a time trend causes a headache when it comes time to derive the large sample
properties of the OLS estimator since x'x will no longer be finite element-wise.
Problems with D-F and augmented D-F
1. The error term may have a moving average term in it.
Suppose A(L)yt=C(L)et and the roots
of C(L) all lie outside the unit circle so C(L) is invertible. Then

Unfortunately D(L) will be of infinite order, but we can use our earlier procedure
to write
With our finite data sets we might be in trouble if not for the fact that it has
been shown empirically that a good approximation will cut off the distributed lag
at the T/3 term.
- 2. What is the appropriate lag length for the differenced terms included on the RHS?
The problem of too many lags reduces the efficiency of the estimator. This is
a much less serious problem than using too few lags. As pointed out before,
excluding relevant variables will affect the bias and consistency of the OLS
estimator.
3. DF tests to see if there is at least one root. Suppose there are more?
For example, one could estimate the parameters of the model
(1-L)2yt = b1(1-L)yt-1 + et . One would then use the DF
statistics, as appropriate
to the case, to test b1 = 0. If b1=0 then there are
2 unit roots, if it is not
zero then one must go on and test to see if there is a single unit root.
The procedure is generalized in the obvious way.
4. How do we know which deterministic regressors belong in the model?
The procedures used in the FRB production example and in problems 2 and 3 use
cascading tests of hypothesis. As is shown in Theil, Principles of Econometrics, Wiley,
1971, this reduces the purported significance level of the test in each succeeding step.
Along the same lines, Judge and his numerous coauthors would argue that the procedure
outlined in the flow chart puts in the realm of pretesting and hence higher squared error
loss over a large part of the parameter space. Nonetheless, in applied work we often
disregard these caveats and use the process in the flow chart.
Another Example: Purchasing Power Parity
Under PPP, the rate of currency depreciation is approximately equal to the difference
between the domestic and foreign inflation rates. The PPP model implies
et= pt - p*t + dt
where pt = log of the US price level
p*t = log of the foreign price level
et = log of the dollar price of foreign exchange
dt = deviation from PPP at time t
The three data series apply the log transformation so that we are using inflation rates.
In certain PPP models it is possible for real shocks to either demand or supply to cause
permanent deviations. Intuitively the deviations should not persist or there would be
substantial opportunities for profit taking. And anyway such profit taking and arbitrage
would restore PPP eventually. A popular procedure in the empirical modeling of PPP is to
construct the series
rt = et + pt* - pt
If PPP is to hold then rt must be stationary with a zero mean. Furthermore
there can be neither trend nor stochastic drift. To digress and anticipate the material in
another section, et, pt and p*t are said to be
cointegrated when the PPP model is true. This specific formulation of the model imposes a
specific cointegrating vector on the three variables.
Fit the model

to monthly data for the pre- (1960.1 - 1971.4, T=136) and post- (1973.1 - 1986.11, T=167)
Bretton Woods eras to get the following results, with coefficient standard errors in
parentheses:
|
g
|
a0
|
a2
|
SD
|
SEE
|
t
|
1973-86
|
-.047
(.074)
|
1.25
|
-.297
|
10.44
|
2.81
|
-.63
|
1960-71
|
-.030
(.028)
|
.97
|
|
.017
|
.005
|
-1.04
|
|
|
|
|
|
|
|
- Note that a2 =0 for the latter period. This reason alone calls into question
the validity of the PPP.
- In neither period can we reject the null of a unit root. The observed t is small by any standard.
- The change in exchange rate regime has made exchange rates more volatile and
unpredictable (see the SD and SEE).
In this example we fail to reject the null of a unit root. We cannot believe in the
PPP model. But our testing procedure is predicated on the constant variance of the error
term, which does not appear to be the case.
Phillips and Perron have devised corrected test statistics for the instances in which the
error is an MA, is perhaps heterogeneous, or there is a structural break in the data.
Structural Change
How can we tell the difference between a series which has a structural break in it,
but would otherwise be stationary, and a series which is not stationary, but which due to
an impulse seems to evolve like the first series?
Consider a model in which there is a shift in the intercept
yt = .5 yt-1 + et + DL
where DL is one for many consecutive periods and zero otherwise. An example
is the following figure.
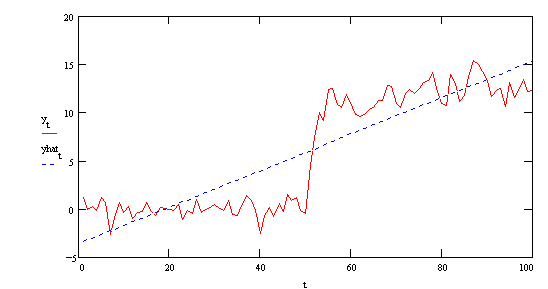
The red line is the original series. The blue line is the simple regression of yt
on time (a=-3.543, b=.189). In the regression of yt on yt-1 we get
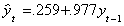
Apparently the structural break causes the coefficient on yt-1 to be biased
toward one. For all appearances yt is not stationary, although we know it to be
stationary both before and after the break at t=50. Even without doing the test for this
case, we would not expect Dickey-Fuller to be very robust against these models with a
structural break in them. Indeed the observed test statistic is t=.507
Now consider a non-stationary model in which there has been a once and done pulse
yt = yt-1 + et + DP
where DP is one in a given period and zero otherwise? An example is in the
following figure:
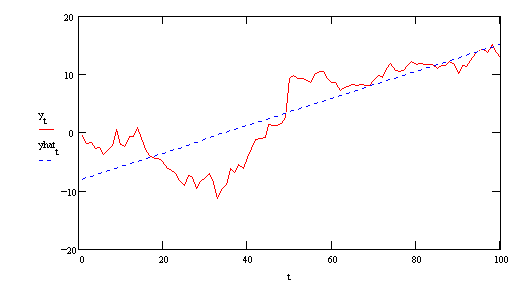
The red line is the original series. The blue line is the simple regression of yt
on time (a=-8.086, b=.233). There is an apparent break at t=50. The regression of yt
on its lagged value gives us
Even without a formal test, the size of the coefficient leads us to suspect a unit
root, which is indeed the case. Without a statistical test we really cannot distinguish
this case from the prior instance.
Phillips and Perron have developed a test for this problem. Consider the working model
in which DP is a pulse equal to one in a period and zero otherwise, DL
is one for some consecutive periods and zero otherwise.
Step 1. Estimate the coefficients of the full model.
Step 2. Compare the t-statistics to the critical values in Perron. Of particular interest
will be the coefficient a1.
When Perron used this method to analyze the Plosser-Nelson data he found that most macro
time series are trend stationary.